Research · Published 26 October 2026
Aviator Simulation Study: What 10 Million Rounds Reveal About Cash-Out Strategies
Players are told that the right cash-out target, betting system or "signal" can make Aviator profitable. We tested the most common strategies on 10,000 simulated sessions each, using the game's published 97% return-to-player model. This page contains the results, the method and the full data, free to reuse with attribution.
Key findings
- ●83.5% of 1,000-round sessions at a 2x auto cash-out end with less money than they started with.
- ●Every cash-out target tested (1.2x to 10x) loses about 3% of the money wagered; the average session ends near $705 of a $1,000 bankroll.
- ●Losing streaks are normal: at 2x the typical session contains a run of 9 losses in a row, and 1 session in 10 sees 12 or more.
- ●The Martingale (doubling after each loss) could not continue in 96.3% of sessions because the next bet exceeded the balance.
- ●Half of all rounds end below 1.93x, and about 4 in 100 rounds crash instantly at 1.00x.
- ●Higher targets don't help: at 10x, 38.9% of sessions went broke before the 1,000th round.
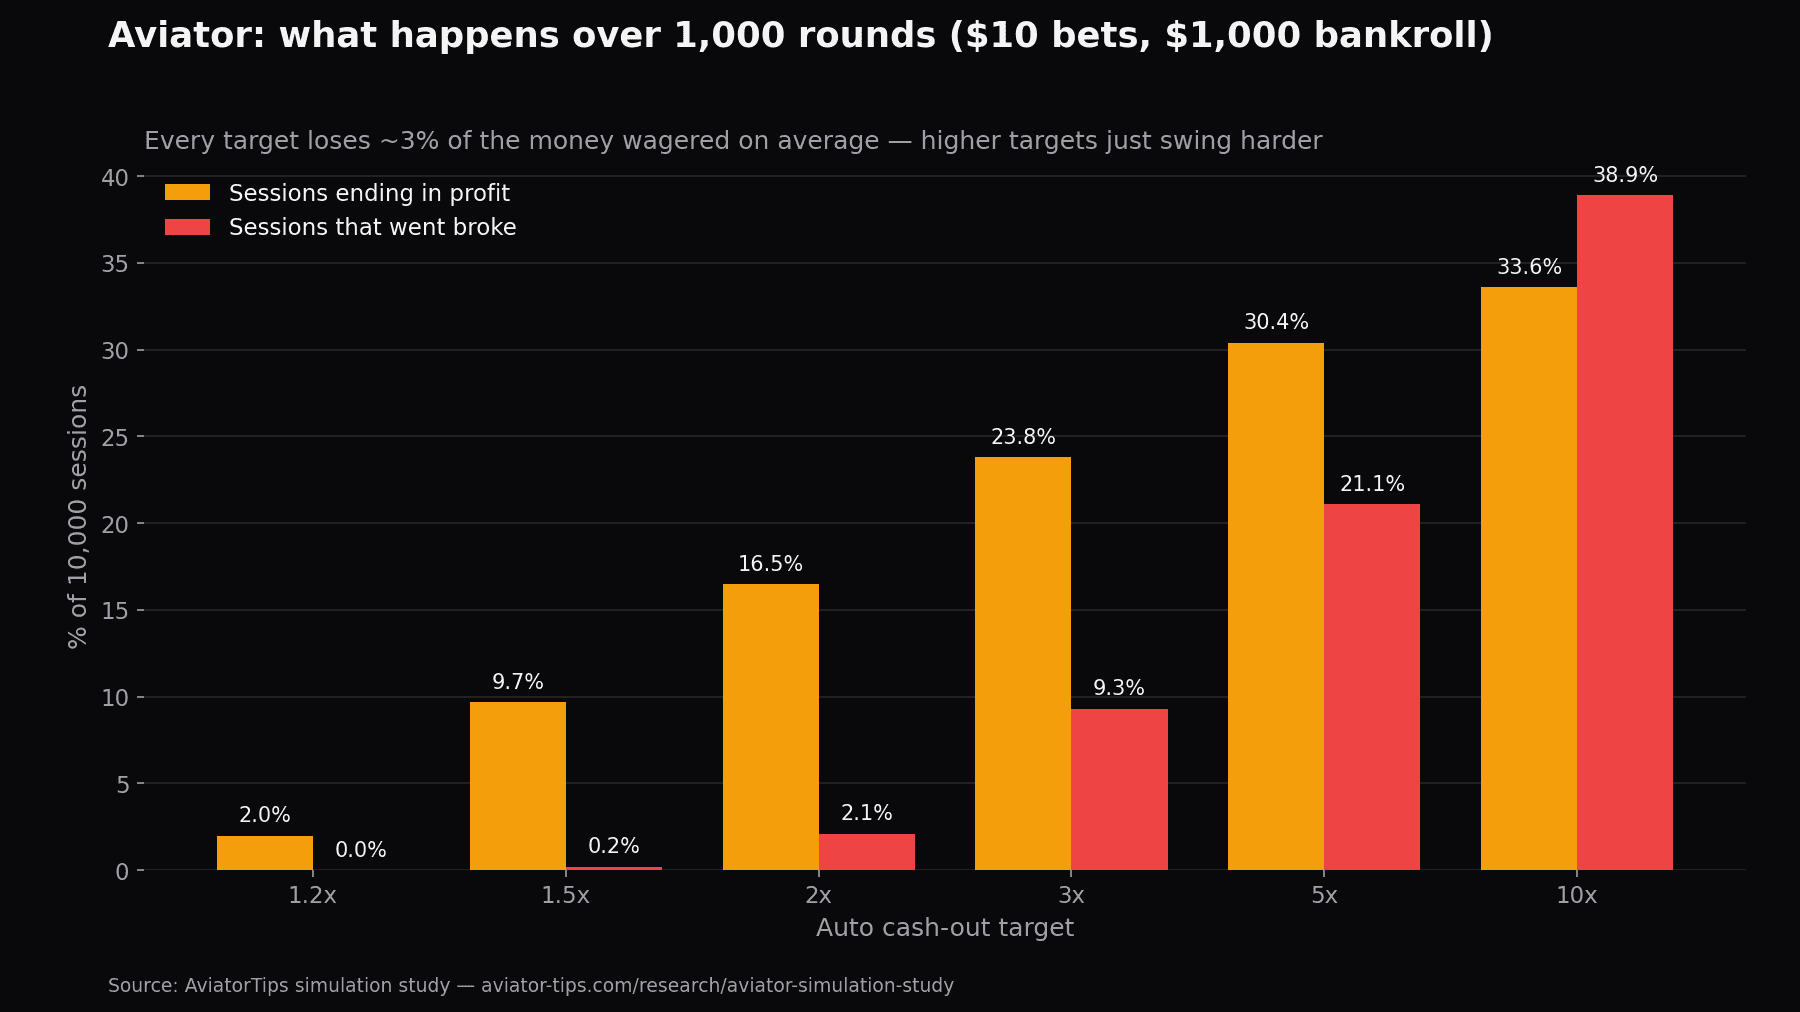
Results by Cash-Out Target
| Auto cash-out | Rounds won | Sessions in profit | Sessions broke | Average end balance | Worst 10% / best 10% | Typical longest losing streak |
|---|---|---|---|---|---|---|
| 1.2x | 80.83% | 2% | 0% | $700 | ≤ $504 / ≥ $888 | 4 (1 in 10: 5+) |
| 1.5x | 64.66% | 9.7% | 0.2% | $699 | ≤ $405 / ≥ $990 | 6 (1 in 10: 8+) |
| 2x | 48.52% | 16.5% | 2.1% | $705 | ≤ $300 / ≥ $1,100 | 9 (1 in 10: 12+) |
| 3x | 32.31% | 23.8% | 9.3% | $701 | ≤ $60 / ≥ $1,260 | 15 (1 in 10: 20+) |
| 5x | 19.41% | 30.4% | 21.1% | $726 | ≤ $0 / ≥ $1,500 | 25 (1 in 10: 34+) |
| 10x | 9.69% | 33.6% | 38.9% | $747 | ≤ $0 / ≥ $1,900 | 46 (1 in 10: 63+) |
The average outcome barely moves with the target: players get back about 97 cents per dollar wagered. Average balances look slightly better at 5x and 10x only because many of those sessions went broke early and stopped wagering. What the target changes is the spread: low targets produce small, predictable losses; high targets produce more wins and far more wipe-outs.
Betting Systems: Martingale and "Recovery"
| System (2x cash-out, $10 base bet) | Could not continue | Sessions in profit | Average end balance |
|---|---|---|---|
| Martingale (double after a loss) | 96.3% | 15.4% | $775 |
| "Recovery" (+50% after a loss) | 63.1% | 29.3% | $635 |
"Could not continue" means that, at some point, the next bet required by the system was larger than the remaining balance — the moment a progression system breaks. Both systems hit that wall in the large majority of sessions, because losing streaks of 9–12 rounds are normal at 2x.
Do Stop-Loss and Stop-Win Limits Help?
Setup: 2.0x, $10 bets, stop at +30% / -25%, max 200 rounds. Result: 31.6% of sessions ended in profit, but only 1.2% reached the +30% target, while 15.3% hit the −25% stop. The average session ended at $944. Limits don't create an edge; they cap how much a single session costs, mainly by reducing the amount wagered.
Where the Plane Flies Away
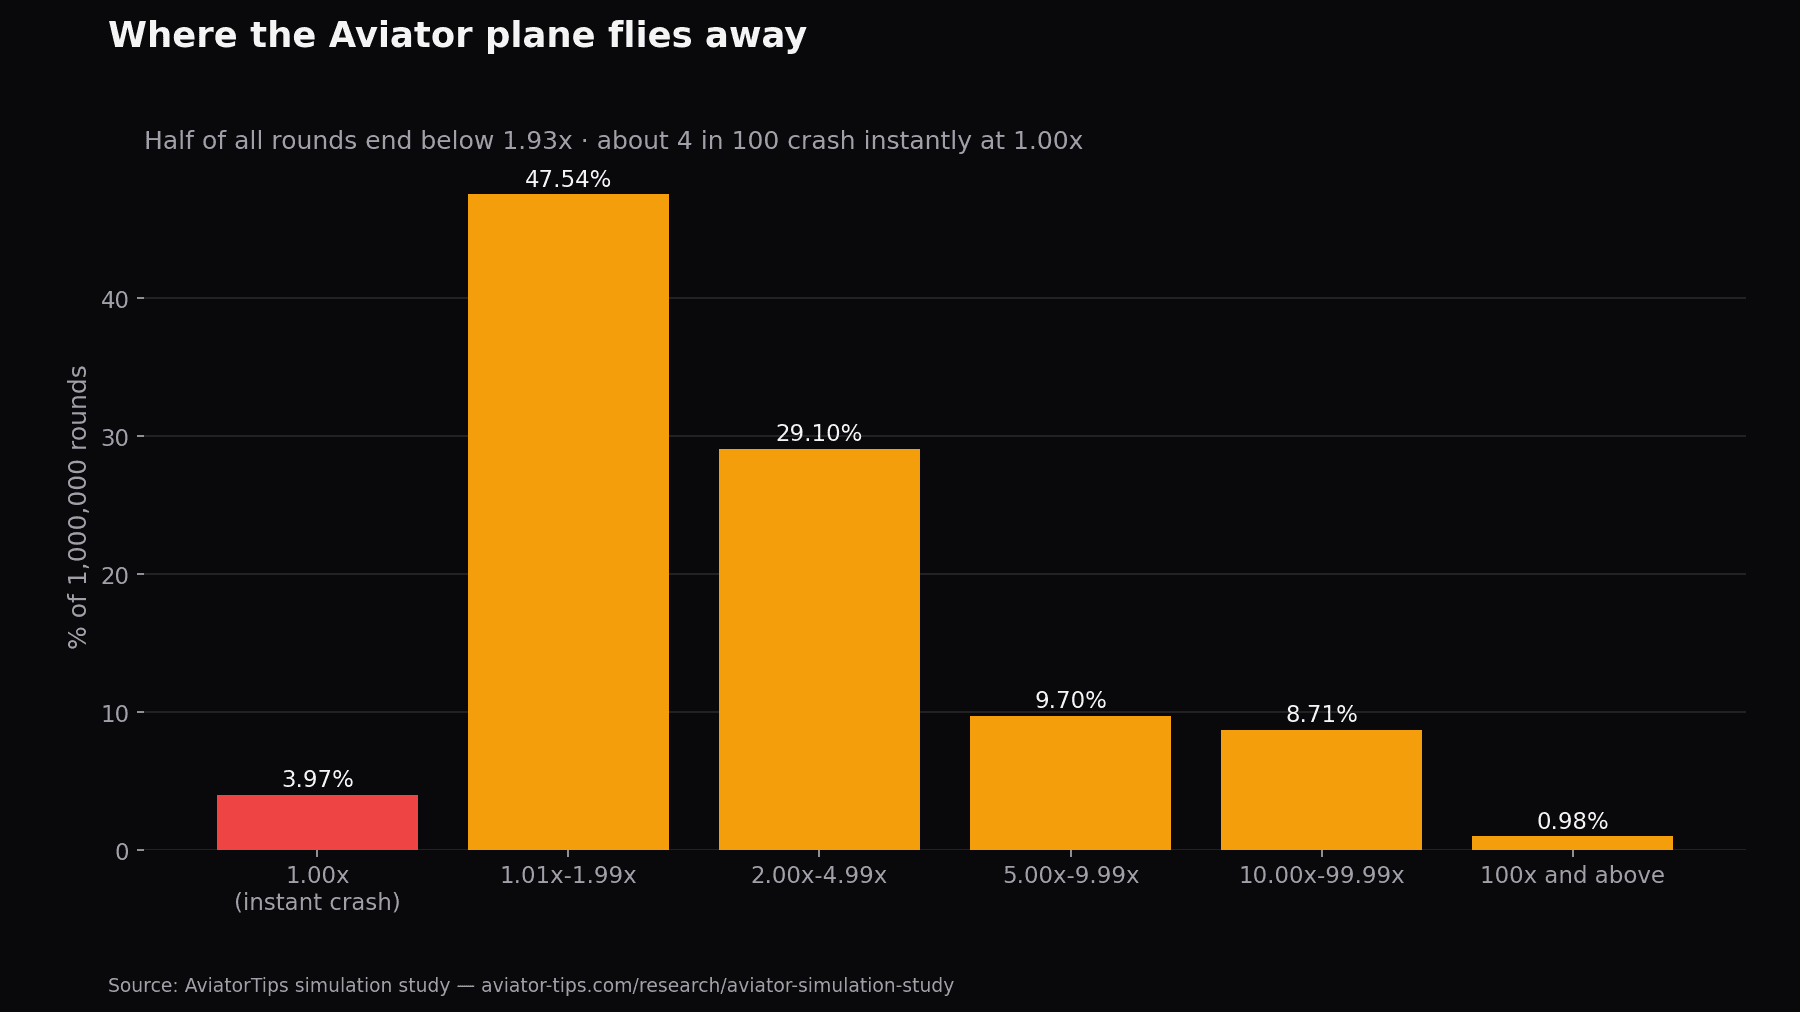
| Multiplier reached | Observed | Theoretical (0.97 ÷ x) |
|---|---|---|
| 1.1x | 88.152% | 88.182% |
| 1.2x | 80.773% | 80.833% |
| 1.5x | 64.635% | 64.667% |
| 2x | 48.484% | 48.5% |
| 3x | 32.281% | 32.333% |
| 5x | 19.383% | 19.4% |
| 10x | 9.687% | 9.7% |
| 20x | 4.852% | 4.85% |
| 50x | 1.939% | 1.94% |
| 100x | 0.976% | 0.97% |
Method
- Game model. Each round's crash point is drawn so that the chance of reaching a multiplier x is 0.97 ÷ x (97% RTP), rounded down to two decimals, with values below 1.00 treated as an instant crash at 1.00x. This is the standard crash-game distribution consistent with Aviator's published RTP; it is not Spribe's source code, and real rounds are provably fair and cannot be predicted.
- Sessions. 10,000 independent sessions of 1,000 rounds per strategy (10 million rounds each), $1,000 starting bankroll, $10 base bet.
- Broke. A session stops when the balance can no longer cover the next bet.
- Reproducibility. Python/NumPy, fixed random seed (2026). Re-running produces identical figures; small differences appear with other seeds. Source code: github.com/Bigbloo/aviator-crash-simulator (MIT).
- Limits. Real players vary bet sizes, play sessions of different lengths and may receive bonuses or cashback; those change individual outcomes, not the 3% house edge on wagers.
Download the Data
- flat_sessions.csv — results by cash-out target
- crash_distribution.csv — crash point distribution
- results.json — all results
- aviator-strategy-chart.pdf — printable odds chart (A4)
- Simulator source code on GitHub — reproduce every figure
Use and Citation
The text, charts and data on this page are published under CC BY 4.0: you may republish them, including commercially, as long as you credit AviatorTips and link to this page. Suggested citation:
AviatorTips (2026). Aviator Simulation Study: What 10 Million Rounds Reveal About Cash-Out Strategies. https://aviator-tips.com/research/aviator-simulation-study
Embed Figure 1 on your site:
<a href="https://aviator-tips.com/research/aviator-simulation-study"><img src="https://aviator-tips.com/research/aviator-session-outcomes.png" alt="Aviator simulation: share of sessions in profit and broke by cash-out target" width="720" loading="lazy"></a>
<p style="font-size:13px">Source: <a href="https://aviator-tips.com/research/aviator-simulation-study">AviatorTips Aviator simulation study</a> (CC BY 4.0)</p>Journalists and researchers: for questions or additional runs (other bankrolls, bet sizes or strategies), contact contact@aviator-tips.com.
Related
- Aviator calculator — run your own session simulation in the browser.
- How the Aviator algorithm works
- Why Aviator predictor apps and signals are scams
- Responsible gambling